
NSDT工具推荐: Three.js AI纹理开发包 - YOLO合成数据生成器 - GLTF/GLB在线编辑 - 3D模型格式在线转换 - 可编程3D场景编辑器 - REVIT导出3D模型插件 - 3D模型语义搜索引擎 - AI模型在线查看 - Three.js虚拟轴心开发包 - 3D模型在线减面 - STL模型在线切割 - 3D道路快速建模
移动数据是设备的地理位置,通过正常活动被动产生。 它具有从交通规划到迁移预测的重要应用。 由于移动数据稀有且难以收集,研究人员已开始探索综合生成移动数据的解决方案。
在本文中,我将讨论一种用于合成移动数据的简单解决方案。 该合成数据可用于研究目的和训练/微调算法。 例如,可以综合生成标记的移动数据,并训练模型来预测城市交通拥堵。 然后,训练好的模型可以应用于现实生活中的数据。
代码可以在这里找到,你可以使用这个 colab 笔记本自己尝试一下。
1、合成数据结构
合成数据将代表从手机设备收集的位置数据记录。 通常,此类数据包含以下属性:
- phone_id — 手机的唯一标识符
- phone_type — 手机操作系统(iOS / Android)
- 时间戳(以纪元时间为单位)
- 纬度
- 经度
- 精度(以米为单位)
phone_id,phone_type,timestamp,latitude,longitude,accuracy
cfcd208495d565ef66e7dff9f98764da,iOS,2022-01-01 00:00:10,30.34639898170681,-97.73158031325373,81.12640643460236
cfcd208495d565ef66e7dff9f98764da,iOS,2022-01-01 00:09:13,30.34642963771432,-97.73140260170493,25.094041385659516
cfcd208495d565ef66e7dff9f98764da,iOS,2022-01-01 00:18:55,30.346380588102306,-97.73148816652471,122.98442053366325
cfcd208495d565ef66e7dff9f98764da,iOS,2022-01-01 00:28:16,30.34643576891581,-97.7315210760708,185.08383036465293
cfcd208495d565ef66e7dff9f98764da,iOS,2022-01-01 00:37:36,30.346366281965476,-97.73138285597729,55.565838723523676
cfcd208495d565ef66e7dff9f98764da,iOS,2022-01-01 00:47:04,30.346372413166982,-97.7316461323459,36.26985794887487
cfcd208495d565ef66e7dff9f98764da,iOS,2022-01-01 00:56:20,30.346384675569983,-97.73156056752609,144.42897717113405
cfcd208495d565ef66e7dff9f98764da,iOS,2022-01-01 01:05:23,30.34640511290831,-97.73140918361412,43.246590356759704
cfcd208495d565ef66e7dff9f98764da,iOS,2022-01-01 01:14:25,30.34634584462714,-97.73150791225235,46.35681270455376
cfcd208495d565ef66e7dff9f98764da,iOS,2022-01-01 01:23:57,30.346441900117316,-97.73162638661823,157.83382148809042
2、获取公开的位置数据
在美国选择一个位置并创建一个 x 米的 bbox(边界框)。 接下来,获取公共数据集:
- 居住地点 — bbox 内的建筑物示例 (ArcGIS Rest API)
- POI(兴趣点)— bbox 内的企业 (Kaggle数据集)
- Roads — bbox 内的所有道路,以图表形式表示(OSM Overpass API,使用 osmnx)
创建包围框:
import osmnx as ox
lat, lng, radius = 45.496920, -122.665803, 10000
bbox = ox.utils_geo.bbox_from_point((lat, lng), radius)
bbox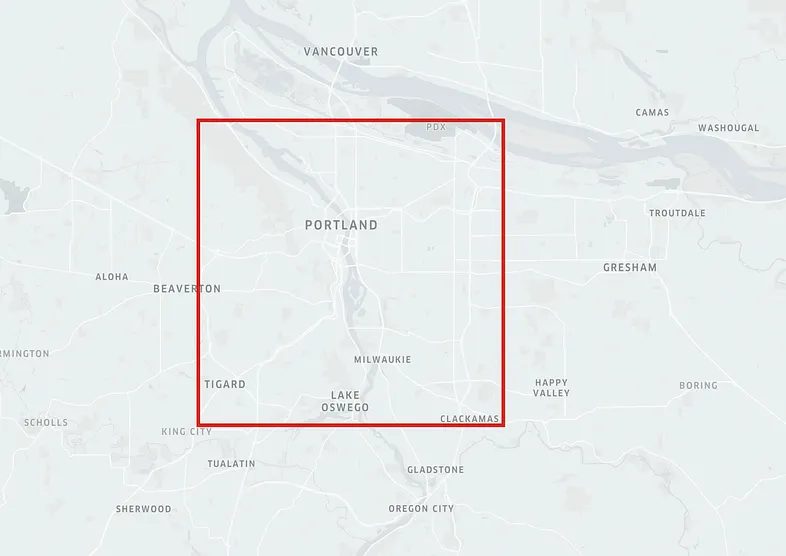
使用 arcgis_rest_url 获取 bbox 内建筑物的多边形,最多2000 个多边形样本。
import geopandas as gpd

ARCGIS_REST_URL = 'https://services.arcgis.com/P3ePLMYs2RVChkJx/ArcGIS/rest/services/MSBFP2/FeatureServer/0/query?f=json&returnGeometry=true&spatialRel=esriSpatialRelIntersects&geometry={"ymax":%s,"ymin":%s,"xmax":%s,"xmin":%s,"spatialReference":{"wkid":4326}}&geometryType=esriGeometryEnvelope&outSR=4326'

residence_df = gpd.read_file(ARCGIS_REST_URL % bbox)
residence_df['lat'] = residence_df['geometry'].centroid.y
residence_df['lng'] = residence_df['geometry'].centroid.x
residence_df.head()
结果如下:
	BlockgroupID	geometry	lat	lng
0	410510005012	POLYGON ((-122.59120 45.48139, -122.59120 45.4...	45.481425	-122.591104
1	410510059001	POLYGON ((-122.67869 45.49746, -122.67869 45.4...	45.497409	-122.678765
2	410510074002	POLYGON ((-122.60844 45.56566, -122.60844 45.5...	45.565693	-122.608380
3	410050216022	POLYGON ((-122.59890 45.43605, -122.59890 45.4...	45.435959	-122.598965
4	410510017012	POLYGON ((-122.58212 45.52941, -122.58212 45.5...	45.529375	-122.582223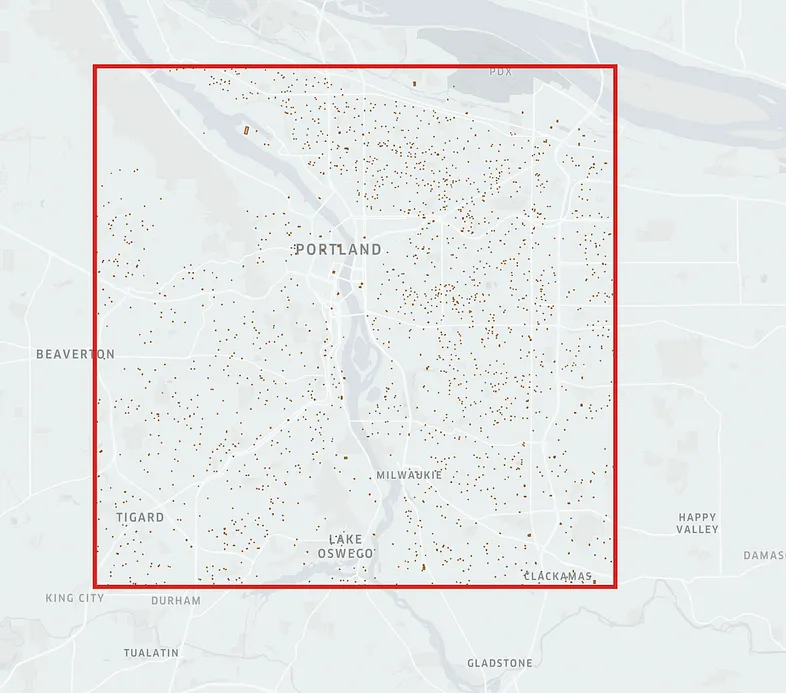
使用 Kaggle API 下载 POI 数据集。 然后解析它,将其加载到 geopandas 并将数据集过滤为仅 bbox 内的点。
def isin_box(lat, lng, bounds):

    ymax, ymin, xmax, xmin = bounds

    within = False

    if xmin < lng < xmax:
        if ymin < lat < ymax:
            within = True

    return within

import os
import json
import pandas as pd
from shapely.geometry import Point

export_path = '<your_export_path_here>'

API_TOKEN = {"username": 'your_kaggle_username_here', "key": 'your_kaggle_key_here'}

os.system('mkdir ~/.kaggle')
os.system('touch ~/.kaggle/kaggle.json')


with open('/root/.kaggle/kaggle.json', 'w') as file:
    json.dump(API_TOKEN, file)

os.system('chmod 600 ~/.kaggle / kaggle.json')
os.system(f'mkdir /{export_path}/pois_data/')

os.system(f'kaggle datasets download -d timmofeyy/-pizza-hut-restaurants-locations-in-us -p /{export_path}/pois_data/pizza-hut --unzip')
os.system(f'kaggle datasets download -d timmofeyy/-walmart-stores-location -p /{export_path}/pois_data/walmart --unzip')
os.system(f'kaggle datasets download -d appleturnovers/dunkin-locations -p /{export_path}/pois_data/dunkin --unzip')
os.system(f'kaggle datasets download -d timmofeyy/-subway-locations-in-us -p /{export_path}/pois_data/subway --unzip')

pois_dfs = []

for chain_name in os.listdir('/content/pois_data'):
    chain_file = [i for i in os.listdir(f'/{export_path}/pois_data/{chain_name}') if i.endswith('.csv')][0]
    chain_df = pd.read_csv(os.path.join(f'/{export_path}/pois_data', chain_name, chain_file))
    chain_df['poi_name'] = chain_name
    chain_df = chain_df.rename(columns={'latitude': 'lat',
                                        'longitude': 'lng',
                                        'lon': 'lng',
                                        'loc_lat': 'lat',
                                        'loc_long': 'lng',
                                        'Latitude': 'lat',
                                        'Longitude': 'lng'})[['poi_name', 'lat', 'lng']]

    chain_df['lat'], chain_df['lng'] = chain_df['lat'].astype(float), chain_df['lng'].astype(float)
    pois_dfs.append(chain_df)

pois_df = pd.concat(pois_dfs, ignore_index=True)
pois_df = pois_df.dropna(subset=['lat', 'lng'], how='any')

pois_df = pois_df[pois_df.apply(lambda x: isin_box(x['lat'], x['lng'], bbox), axis=1)]
pois_df['id'] = pois_df.index
pois_df['geometry'] = pois_df.apply(lambda x: Point(x['lng'], x['lat']), axis=1)
pois_df = gpd.GeoDataFrame(pois_df)

pois_df.head()
结果如下:
	poi_name	lat	lng	id	geometry
2996	Pizanos Pizza	45.516327	-122.559344	2996	POINT (-122.55934 45.51633)
3626	Washington Street Palace	45.518799	-122.654747	3626	POINT (-122.65475 45.51880)
6131	Fred Meyer	45.586069	-122.738125	6131	POINT (-122.73813 45.58607)
7392	Moberi	45.510439	-122.682163	7392	POINT (-122.68216 45.51044)
7920	Ether	45.526996	-122.698438	7920	POINT (-122.69844 45.52700)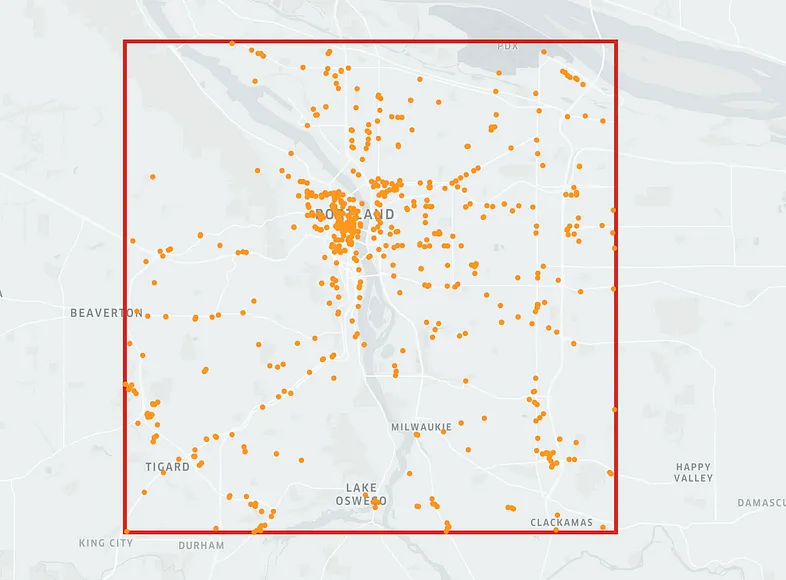
从 Overpass API 获取 OSM 道路:
G = ox.graph_from_bbox(*bbox, network_type="drive", retain_all=True, truncate_by_edge=True)结果如下:

现在我们已经拥有了创建电话时间线所需的一切 — 居住位置(将用于在家中、家人和朋友家中的停留)、POI 位置(将用于商店访问)和道路(将用于 住宿期间开车)。 在生成实际的移动数据之前,我们将生成一个综合时间线,其中包含手机停留时间及其时间范围。
3、生成合成时间线
合成时间线逻辑将迭代开始日期和结束日期之间的所有日期,并随机化在工作场所、居住地点和 POI 的停留时间。 为了保证正常的人类行为,该逻辑将仅在工作日产生工作停留,并确保用户晚上回家。
在运行逻辑之前,请确保:
- 设置随机的家庭和工作地点
- 设置时间范围(开始日期和结束日期)
- 设置指定日期要访问的最大 POI 和最大居住地点
home_info = residence_df.sample(1).to_dict(orient='records')[0] # pick a random home location
work_info = pois_df.sample(1).to_dict(orient='records')[0] # pick a random work location
start_date = '2022-10-01' # timeline start time
end_date = '2022-11-01' # timeline end time
max_residence = 3 # max residence stay in a day
max_pois = 3 # max poi stay in a day

from datetime import timedelta
import numpy as np

phone_timeline = []

stays_counter = 0
for day in pd.date_range(start_date, end_date):

  n_residence = np.random.choice(range(1, max_residence))
  n_pois = np.random.choice(range(1, max_pois))

  levaing_hour = np.random.choice([6,7,8])
  start_time = day
  end_time = day + timedelta(hours=int(levaing_hour))

  phone_timeline.append({'stay_id': stays_counter,
                                "start_time": start_time,
                                "end_time": end_time,
                                'entity_id': 'home',
                                'entity_name': 'home',
                                'entity_type': 'home',
                                'lat': home_info['lat'],
                                'lng': home_info['lng']})
  stays_counter+=1


  if day.weekday() not in [5,6]: # if working day
    working_hours = np.random.choice([7,8,9])
    start_time = end_time
    end_time += timedelta(hours=int(working_hours))

    phone_timeline.append({'stay_id': stays_counter,
                              "start_time": start_time,
                              "end_time": end_time,
                              "entity_id": 'work',
                              'entity_name': 'work',
                              'entity_type': 'work',
                              'lat': work_info['lat'],
                              'lng': work_info['lng']})
    stays_counter+=1

  time_left = 24 - end_time.hour
  if n_residence !=0 or n_pois !=0:
    time_left -= 1 # leave 1 hour to stay at home at the end of the timeline
    time_per_stay = np.floor(time_left/(n_residence + n_pois))

    if n_residence !=0:
      for row in residence_df.sample(n_residence).itertuples():

        start_time = end_time
        end_time += timedelta(hours=int(time_per_stay))
        time_left -= time_per_stay

        phone_timeline.append({'stay_id': stays_counter,
                            "start_time": start_time,
                            "end_time": end_time,
                            'entity_name': row.Index,
                            'entity_type': 'building',
                            'entity_id': row.Index,
                            'lat': row.lat,
                            'lng': row.lng})
        stays_counter+=1

    if n_pois !=0:
      for row in pois_df.sample(n_pois).itertuples():

        start_time = end_time
        end_time += timedelta(hours=int(time_per_stay))
        time_left -= time_per_stay

        phone_timeline.append({'stay_id': stays_counter,
                            "start_time": start_time,
                            "end_time": end_time,
                            'entity_name': row.poi_name,
                            'entity_type': 'venue',
                            'entity_id': row.Index,
                            'lat': row.lat,
                            'lng': row.lng})
        stays_counter+=1

  start_time = end_time
  end_time += timedelta(hours=int(time_left))
  phone_timeline.append({'stay_id': stays_counter,
                            "start_time": start_time,
                            "end_time": end_time + timedelta(hours=abs(end_time.hour-24)),
                            'entity_id': 'home',
                            'entity_name': 'home',
                            'entity_type': 'home',
                            'lat': home_info['lat'],
                            'lng': home_info['lng']})
  stays_counter+=1
phone_timeline = pd.DataFrame(phone_timeline)
phone_timeline.head()
结果如下:
	stay_id	start_time	end_time	entity_id	entity_name	entity_type	lat	lng
0	0	2022-10-01 00:00:00	2022-10-01 08:00:00	home	home	home	45.410639	-122.552044
1	1	2022-10-01 08:00:00	2022-10-01 10:00:00	1290	1290	building	45.449074	-122.758561
2	2	2022-10-01 10:00:00	2022-10-01 12:00:00	249212	Al's Garden Center	poi	45.458765	-122.710870
3	3	2022-10-01 12:00:00	2022-10-01 14:00:00	502973	Lloyd Center	poi	45.532621	-122.653473
4	4	2022-10-01 14:00:00	2022-10-01 16:00:00	225659	B&B Barbershop	poi	45.483497	-122.581378
下面的 gif 显示了我们合成时间线中的第一天:

4、生成合成移动数据(信号)
我们的合成时间线已准备就绪,需要新的逻辑将其转换为合成信号。 我们时间线中的第一个事件是寄宿家庭 (00:00 -> 08:00),所以让我们从为这次住宿生成信号开始。
4.1 静态模式信号
以下脚本将生成停留开始和停留结束之间的信号数据帧。 采样率(相邻信号之间的时间间隔)是一个可配置的参数。 我将其设置为 600 秒(5 分钟)。 每个信号的 lat,lng 将使用随机“噪声系数”进行噪声处理
def generate_static_signals(lat, lng, start_time, end_time, sampling_rate=600):

  signals_list = []
  signal_time = start_time + timedelta(seconds=int(np.random.choice([5,10,15]))) # start smaple couple of second after visits start

  noise_list = np.linspace(0.9999997, 1.000003) # noise factor

  while end_time > signal_time:
    signals_list.append({'lat': lat*np.random.choice(noise_list),
                          'lng': lng*np.random.choice(noise_list),
                          'timestamp': signal_time})
    signal_time += timedelta(seconds=sampling_rate -
                            int(np.random.choice(range(0,59))))

  return pd.DataFrame(signals_list).sort_values('timestamp')
在第一次停留时应用逻辑将产生以下输出:

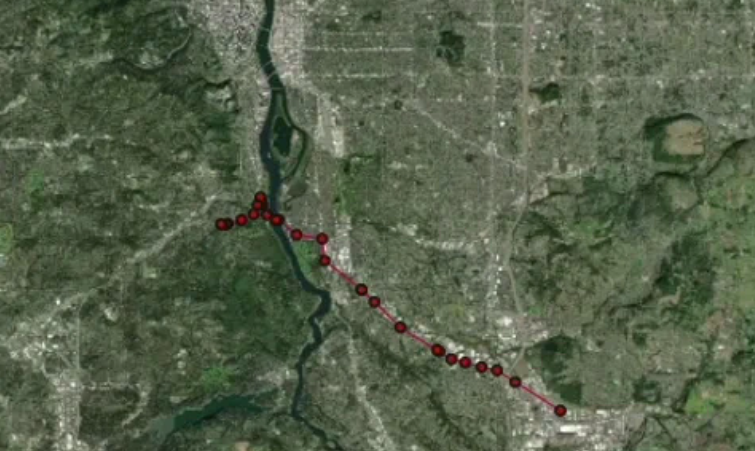
4.2 驾驶模式信号
我们时间线上的下一个事件是在“Residence 1290”停留,但在为本次停留生成信号之前,我们需要为将手机从出发地(家)带到目的地(“Residence 1290”)的驱动器生成信号 。
为此,我们将使用道路图并寻找从起点到目的地的最短路径。 然后,我们将以 60 秒的采样率在有序路段上随机生成信号。
from shapely.ops import linemerge, nearest_points, snap
from shapely.geometry import LineString, Point, MultiLineString
import taxicab as tc
def generate_route_signals(route_geo, start_time, sampling_rate=60):
end_time = start_time + timedelta(minutes=int(np.random.choice(range(15,50))))
N_POINTS = round((end_time - start_time).total_seconds() / sampling_rate)
POINTS_PER_SEGMENT = 10
noise_list = np.linspace(0.9999999, 1.000001) # add noise to points
signal_time = start_time - timedelta(seconds=int(np.random.choice([5,10,15])))
timestamps_list = []
for i in range(0,N_POINTS):
timestamps_list.append(signal_time)
signal_time += timedelta(seconds=sampling_rate + int(np.random.choice(range(0,9))))
line_to_points = np.array(
[
{'lat': y*np.random.choice(noise_list), 'lng': x*np.random.choice(noise_list)}
for p1, p2 in zip(route_geo.coords, route_geo.coords[1:]) # iterate through line segments
for x, y in zip(
np.linspace(p1[0], p2[0], POINTS_PER_SEGMENT),
np.linspace(p1[1], p2[1], POINTS_PER_SEGMENT),
)
])
indexes = np.sort(np.random.choice(range(0, len(line_to_points)),replace=False,
size=min(N_POINTS, len(line_to_points))))
random_points = line_to_points[indexes]
signals_df = pd.DataFrame([i for i in random_points])
signals_df['timestamp'] = timestamps_list[:len(signals_df)]
return signals_df, signal_time
def get_route_geometry(route, orig, dest):
x, y = [], []
for u, v in zip(route[tc.constants.BODY][:-1], route[tc.constants.BODY][1:]):
# if there are parallel edges, select the shortest in length
data = min(G.get_edge_data(u, v).values(), key=lambda d: d["length"])
if "geometry" in data:
# if geometry attribute exists, add all its coords to list
xs, ys = data["geometry"].xy
x.extend(xs)
y.extend(ys)
else:
# otherwise, the edge is a straight line from node to node
x.extend((G.nodes[u]["x"], G.nodes[v]["x"]))
y.extend((G.nodes[u]["y"], G.nodes[v]["y"]))
final_route = []
if route[2]:
final_route.append(LineString([Point(orig[1], orig[0]),
nearest_points(Point(orig[1], orig[0]),route[2])[1]]))
final_route.append(route[2])
else:
final_route.append(LineString([Point(orig[1], orig[0]),Point(x[0],y[0])]))
final_route.append(LineString([Point(lng,lat) for lng, lat in list(zip(x, y))]))
if route[3]:
final_route.append(route[3])
final_route.append(LineString([nearest_points(Point(dest[1],dest[0]), route[3])[1],
Point(dest[1],dest[0])]))
else:
final_route.append(LineString([Point(x[-1],y[-1]), Point(dest[1],dest[0])]))
final_route_geo = linemerge(final_route)
if isinstance(final_route_geo, MultiLineString):
final_route_geo = linemerge([snap(i, j,0.000001) for i,j in zip(final_route, final_route[1:])])
if isinstance(final_route_geo, MultiLineString):
final_route_geo = list(final_route_geo)[np.argmax(np.array([len(i.coords) for i in list(final_route_geo)]))]
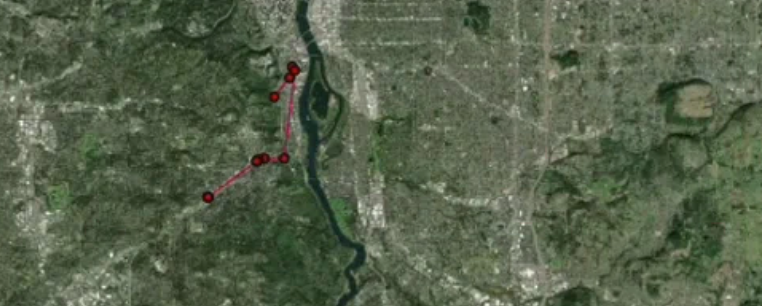
return final_route_geo这就是合成驾驶信号在地图上的样子:
4.3 完整的合成移动数据生成
在最后一步中,我们将迭代所有的合成时间线。 对于每次停留,我们将生成静态模式信号,并且在每两次停留之间,我们将生成驾驶模式信号。
def generate_signals_df(device_timeline, G):

    signals_dfs = []
    drive_end = None

    for row in device_timeline\
    .join(device_timeline[['lat','lng']].shift(-1), lsuffix='_orig', rsuffix='_dest')\
    .dropna(subset=['lat_orig','lng_orig','lat_dest','lng_dest'],how='any').itertuples():

        if not drive_end:
            drive_end = row.start_time

        stay_signals = generate_static_signals(row.lat_orig, row.lng_orig, drive_end, row.end_time)
        signals_dfs.append(stay_signals)

        route = tc.distance.shortest_path(G, (row.lat_orig, row.lng_orig), (row.lat_dest,row.lng_dest))
        route_geo = get_route_geometry(route, (row.lat_orig, row.lng_orig), (row.lat_dest,row.lng_dest))

        drive_signals, drive_end = generate_route_signals(route_geo, row.end_time, 45)
        signals_dfs.append(drive_signals)

    device_signals = pd.concat(signals_dfs, ignore_index=True).sort_values('timestamp')

    return device_signals
好了! 我们现在拥有由开源包和免费数据生成的完整的移动合成数据。
5、结束语
生成合成移动数据是可行的,不需要特殊资源。 我们需要的所有数据都在那里并且可以免费使用。 话虽如此,仍有改进的空间:
- 逻辑的幼稚:逻辑非常简单,因此输出并不能真正代表完整的人类行为(例如出国旅行、移民等)
- 逻辑的效率:逻辑需要一些时间来运行。 主要瓶颈是驾驶生成部分(最短路径计算)
- 逻辑的覆盖范围:仅支持美国,这是因为我使用了
USBuildingFootprints,它非常准确,但不幸的是仅覆盖美国。
原文链接:Generate Synthetic Mobility Data
BimAnt翻译整理,转载请标明出处


